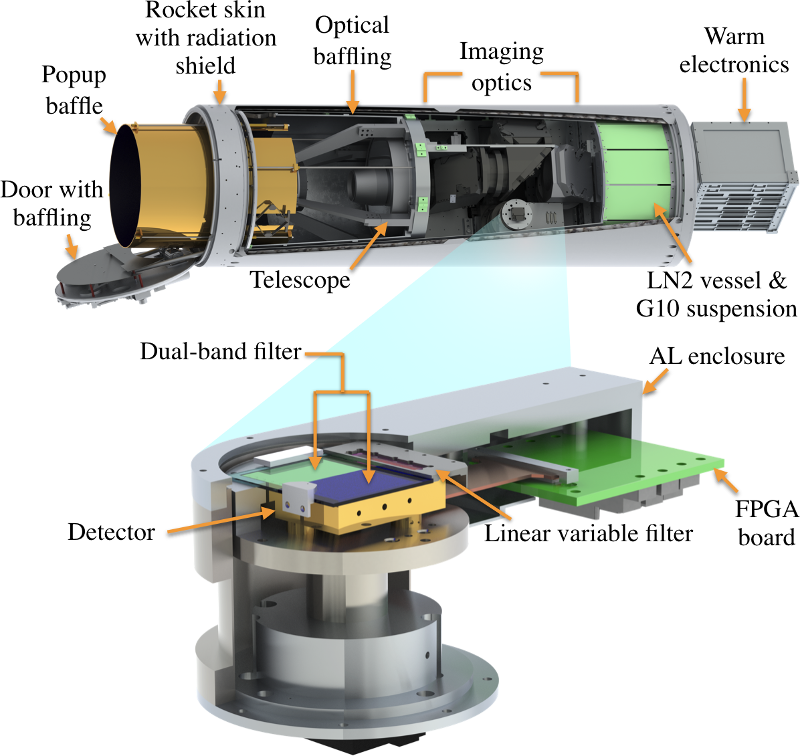
Overview
CIBER-2 is a cryogenic payload using liquid nitrogen to minimize noises in the electronics. CBER-2 will launch multiple times on Black Brant IX (BBIX) rockets with ~300 seconds of scientific data per flight to account for unforeseeable technical errors and incorporate new science and technology developments into the experiment as needed.
| Aperture | 28.5 | cm | |||||
| Pixel size | 4 | arcsec | |||||
| FOV | 2.3 x 2.3 (full) 1.1 x 2.3 per filter |
degrees | |||||
| λ | 0.6 (R) | 0.8 (I) | 1.1 (Z) | 1.3 (J) | 1.6 (H) | 1.8 (Ks) | μm |
| Δλ/λ | 0.33 | 0.25 | 0.19 | 0.12 | 0.16 | 0.17 | |
| Array QE | 0.90 | 0.80 | 0.83 | 0.81 | 0.82 | 0.82 | |
| Optics efficiency | 0.75 | 0.73 | 0.81 | 0.85 | 0.87 | 0.87 | |
| Photo current | 14.7 | 10.3 | 8.50 | 6.20 | 7.60 | 4.30 | e-/s |
| Dark current | 0.25 | 0.09 | 0.25 | e-/s | |||
| Read noise (CDS) | 16 | 19 | 15 | e- | |||
| δνIν inst | 34.3 | 34.5 | 31.4 | 30.0 | 20.3 | 16.9 | nW m-2 sr1 |
| δFν inst | 20.8 | 20.2 | 19.6 | 19.3 | 19 | 18.8 | Vega mag 3σ |
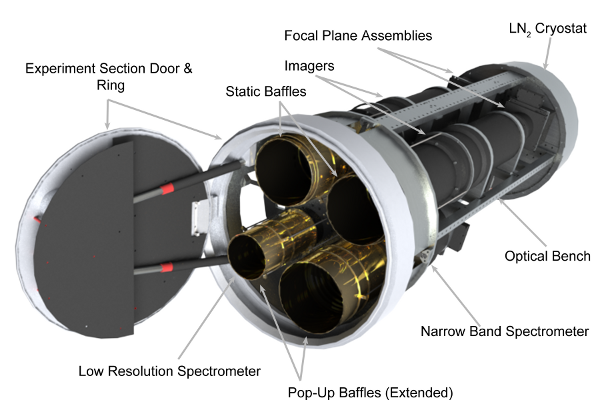
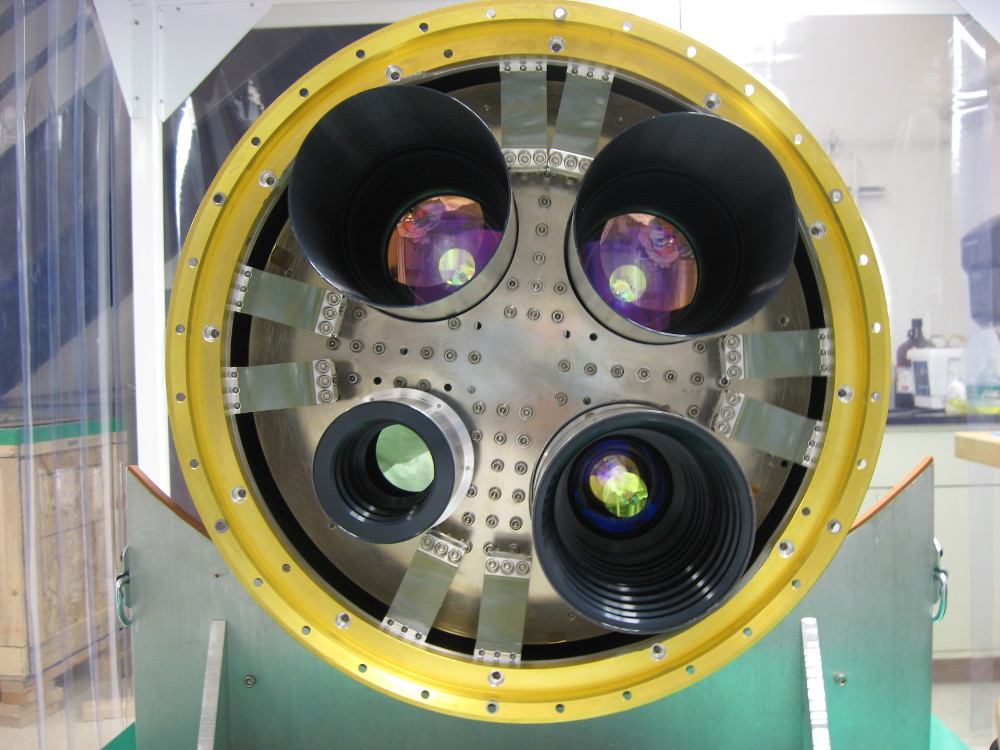
CIBER instruments in the clean room. Top row: the wide field imagers. Bottom row: Low-Resolution Spectrometer (left), Narrow-Band Spectrometer (right).
Overview
Wide-Field Imager measures extragalactic fluctuations on large angular scales. These angular scales are critical to detect the characteristic first-light galaxy power spectrum.
Narrow-Band Spectrometer measures the absolute intensity of the Zodiacal brightness using the reflected CaII 854.2 nm Fraunhofer absorption line in order to test Zodiacal dust models.
Low-Resolution Spectrometer searches for the Lyman cutoff signature of reionization in the IRB. At the IRB level reported by the IRTS, such a bright feature would be apparent without any foreground subtraction. It will also measure the Zodiacal color.
The wide-field imager probes large angular scales where first-light fluctuations are expected to peak, and where they can best be separated from galaxy clustering and shot noise. The imager data will be combined with shallow Spitzer and Akari survey fields to allow us to detect and remove galaxies in the camera images. CIBER complements these facilities by virtue of its much wider FOV, providing sensitivity to fluctuations on large angular scales, and shorter wavelength coverage, crucial for discriminating a first-light component.
The wide-field imager consists of dual 11-cm refracting telescopes cooled to 77 K, imaging onto two 1024 x 1024 focal plane arrays. All-spherical refracting optics provide diffraction-limited performance from 0.75 to 2.2 μm over a 2deg x 2deg field of view. The spatial resolution is determined by the 7" pixel size, not aberrations or diffraction.
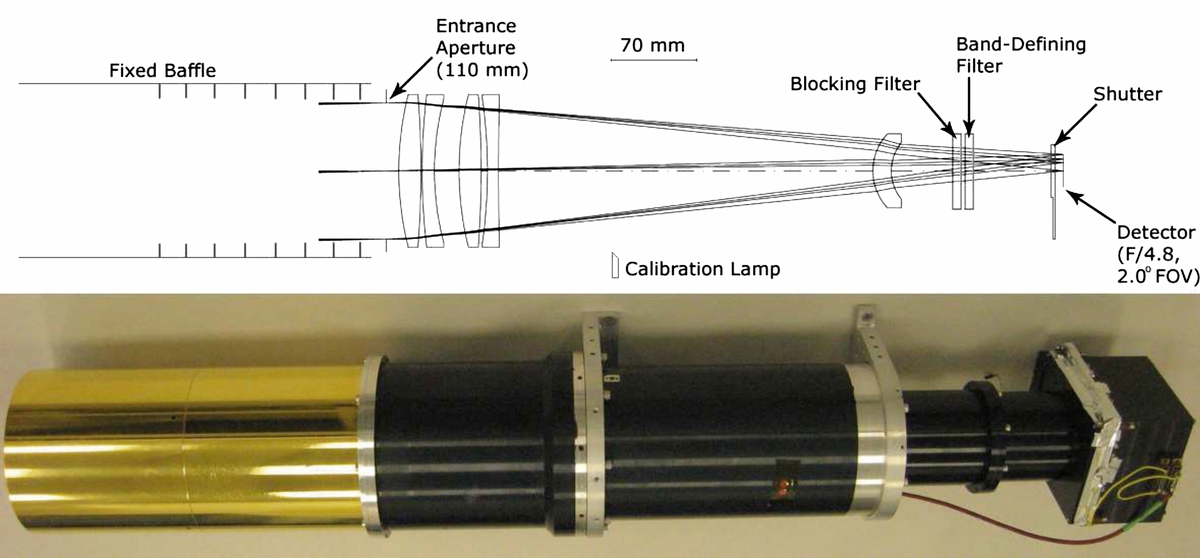
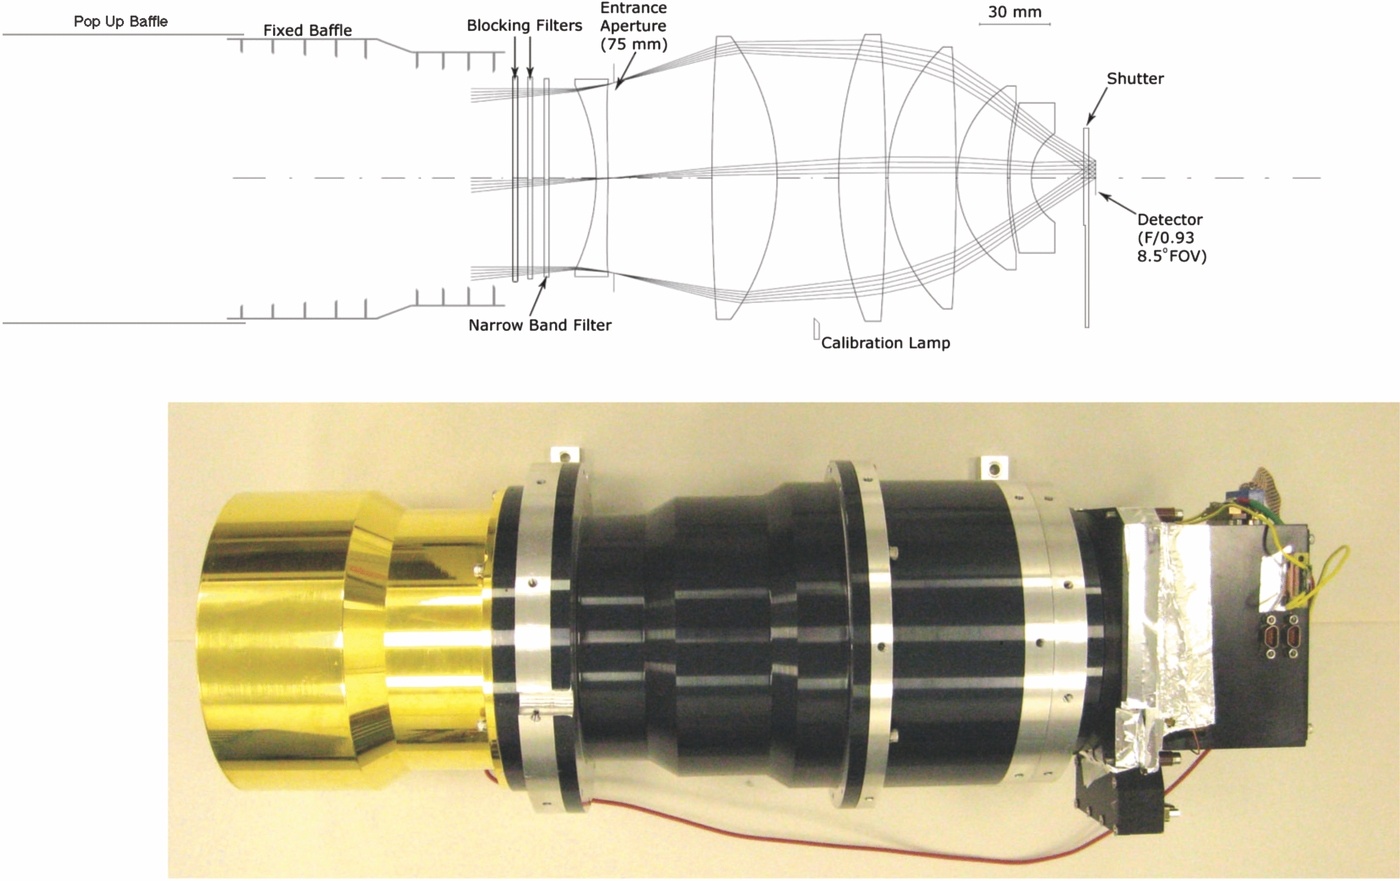
Schematic and photograph of the wide-field imaging telescopes. The lenses are coated with a broad band high-efficiency anti-reflection coating providing > 80 % end-to-end efficiency. The entrance aperture is 11 cm and the total track is 55 cm. [Click to enlarge]
The pixel size of 7" reduces the local-galaxy clustering signal, giving us a sufficient density of pixels to remove sources down to I = 21, H = 20 with modest data loss. CIBER itself reaches a limiting point source sensitivity of I = 18.4 and H = 18.2 mag (3σ); several times deeper than 2MASS. We quote a 3σ threshold because we are only interested in rejecting point sources from the data, not extracting and cataloging them. Source confusion, using deep galaxy counts, is 2-3 times below the instrument noise.
The 1024 detector arrays are sampled continuously every 1.8 s, providing background-limited performance. We use an off-chip JFET follower to eliminate multiplexer glow. In order to minimize dark current associated with temperature drifts, the array is mounted on a thermally isolated stage, which is monitored with sensitive DC-stabilized thermometry and thermally regulated. A cold shutter placed just above the array allows us to record dark frames prior to launch, and on ascent and descent.
Multi-panel simulations in a 2° x 2° field at H-band. Reading from the upper left-hand corner: a) simulated first-light galaxy spatial fluctuations, adapted from numerical simulations of baryonic matter density to match the optimistic power spectrum in Fig. 3; b) galaxies, taken from deep NOAO images; c) combined first-light fluctuations, instrument noise, and H < 24 galaxies; d) combined fluctuations, noise, flat field, and 21 < H < 24 galaxies; e) recovered first-light galaxy fluctuations; f) recovered pessimistic fluctuations. Whereas the optimistic fluctuations are clearly visible above the noise, statistical techniques are needed to extract the pessimistic signal, which is 10 times fainter in surface brightness. [Click to enlarge]
| Aperture | 11 | cm | |
| Pixel size | 7 | arcsec | |
| FOV | 2.0x2.0 | degrees | |
| Integrating time | 50 | seconds | |
| λ | 1.1 (I) | 1.6 (H) | μm |
| Δλ/λ | 0.38 | 0.56 | |
| Array QE | 0.51 | 0.70 | |
| Optics efficiency | 0.9 | 0.9 | |
| Filter efficiency | 0.92 | 0.89 | |
| Total efficiency | 0.42 | 0.56 | |
| Photo current | 4.9 | 11 | e-/s |
| Dark current | 0.35 | 0.45 | e-/s |
| Read noise (CDS) | 10 | 9 | e- |
| νIν (sky) | 420 | 370 | nW m-2 sr1 |
| δνIν inst | 33.1 | 17.5 | nW m-2 sr1 |
| δFν inst | 18.4 | 17.8 | Vega mag 3σ |
| CIBER galaxy cut | 2.2e3, I > 18.4 0.3% |
4.5e3, H > 17.8 0.8% |
#/sq degree mag cut pixel los |
| Deep galaxy cut | 6.0e4, I > 23.0 25% |
6.0e4, H > 21.5 25% |
#/sq degree mag cut pixel los |
Uncertainties in the Zodiacal dust model play a leading role in the systematic errors for determining the IRB. The differences in the data from prior IRB observations at 1.2 μm are principally the result of using different models of the Zodiacal dust based on DIRBE observations. The IRTS residual, based on a modified Kelsall DIRBE dust model, closely follows the spectrum of Zodiacal dust and could be entirely explained by a 23 % error in the Zodiacal dust brightness. The narrow-band spectrometer will provide a new and independent measurement of the Zodiacal dust brightness using Fraunhofer absorption lines. Spectroscopy of optical Fraunhofer lines has been used to estimate and remove the zodiacal light for optical extragalactic background measurements, and to study the dynamics of the zodiacal dust cloud.
Ray trace of the narrow-band spectrometer refracting optics. The narrow-band filter is the first optical element in the assembly. The spectral response of the instrument varies over the FOV, shifting towards shorter wavelengths from center to edge. The entrance aperture is 75 mm. [Click to enlarge]
The narrow-band spectrometer (NBS) is a small wide-field refractor with a narrow-band filter placed as the first optical element. Rays passing through such a dielectric etalon experience a wavelength shift λ = λ0 cos θi, where θi is the angle of the ray inside the dielectric. Thus the wavelength response of the spectrometer varies over the array, by an amount depending on the entrance angle. This can be tailored so that the response at the array center is tuned on a Fraunhofer line, and then shift entirely off the line at the edge of the FOV.
The spectrometer can measure the zodiacal intensity with signal to noise ratio of 50 at the north ecliptic pole in a 50 s observation (with similar S/N at lower ecliptic latitudes in shorter observations). The photon level, signal contrast, and the S/N per pixel, are all low, so careful attention must be paid to dark current, stray light, and out of band blocking.
| Aperture | 7.5 | cm |
| Wavelength | 854.2nm | cm |
| Resolution | 1000 | |
| Pixel size | 2 | arcmin |
| FOV | 8.5x8.5 | degrees |
| F# | 0.9 | |
| F-P efficiency | 0.7 | |
| Optics efficiency | 0.9 | |
| Array | 256x256 | PICNIC HgCdTe |
| Array QE | 0.55 | |
| νIν sky | 550 | nW m-2 sr-1 |
| Photo current | 1.5 | e-/s/td> |
| Contrast | 37 | % |
| Dark current | < 0.1 | e-/s |
| Read noise (CDS) | 30 | e- |
| Integrating time | 50 | s |
| δFν | 40 | mJy, I ~ 12 (3σ) |
| S/N zodi | 150 | 100x100 px |
[Back to Overview]
The low-resolution spectrometer (LRS) is designed to measure the absolute spectrum of the near-infrared background in the 0.8 - 2.0 μm spectral region, in a search for the redshifted Ly-cutoff feature, a signature of UV photon emission from when the universe was partially ionized. The IRB may peak at λ ~ 1-2 μm and fall in brightness in the optical. The transition from the near-infrared to the optical, if confirmed, would have a much different spectral shape than either zodiacal light or the integrated counts of galaxies, providing definitive evidence for a first-light galaxy IRB.
The LRS is a 5 cm refracting telescope with re-imaging optics. A prism inserted in the collimated beam produces low resolution spectra (R = 13 - 25) for wavelength bands from 0.8. μm to 2.0 μm. We use a 256x256 HgCdTe array with a pixel size of 40 μm, producing 1.4' × ~1.4' pixels and total field of view of 5.8deg. Four slits located at the field stop produce 2.8' × ~ 5.8deg strips on the sky, which the prism disperses into separate spectra on the array. As a result, 256 spectra are available for each slit, and a total of 1280 spectra are obtained.
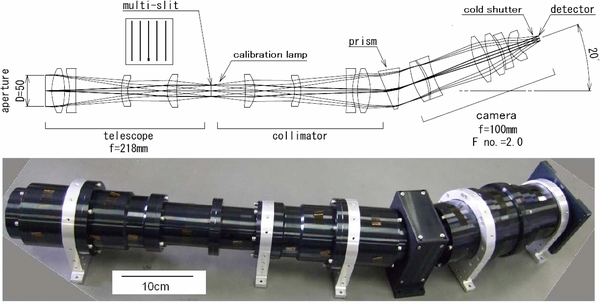
Schematic of the LRS, which uses a prism to disperse radiation through 5 slits onto a 2562 array. The LRS mounts to the 77 K optical bench opposite the wide-field imager. [Click to enlarge]
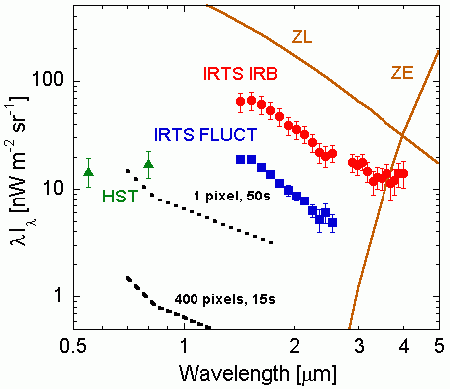
LRS detection limits at 1σ significance (dashed lines) for a single pixel, and for co-adding 400 spatial pixels. The IRTS and HST extragalactic background are shown as red and green data points, respectively. The rms fluctuations reported by the IRTS are shown as blue data points. The zodiacal light spectrum at the ecliptic pole is shown for reference. [Click to enlarge]
The expected LRS sensitivity (summarized in at left) is sufficient to measure the spectra of the IRB excess and the IRB fluctuations reported by the IRTS. In order to obtain an accurate spectrum of the sky, after rejecting spectra that include point sources brighter than 18th mag, 900 individual spectra can be co-added. The resulting sensitivity with 400 spectra, shown by the dashed line in the figure below, allows us to detect the absolute sky brightness with S/N > 100 in only 15 s of integration time.
In fields where more observation time is available we can probe the spectrum of the fluctuating component reported by IRTS. In a single pixel in 50 s, we can detect IRTS fluctuations with S/N ~ 5 as shown in Fig. 8. We anticipate having 1280 spatially independent pixels to this sensitivity.
In order to subtract the Zodiacal foreground for a deeper search, we use the NBS line strength as an absolute tracer of Zodiacal emission. The Zodiacal color between the LRS and NBS is determined by the difference brightness of fields over a range of ecliptic latitudes. The data is also be directly compared with DIRBE, as have scheduled our observations so that all the fields fall within the range of solar elongation angles observed by DIRBE.
The LRS will be absolutely calibrated in the lab with calibrated lamps and a beam-filling thermal source. The calibration will also be measured in flight with stars in our field, and may be compared to the lab calibration with an internal transfer lamp.
| Optics | 14 lenses & 1 prism, 5 slits | |
| Aperture | 50 | mm |
| F# | F/2 | |
| FOV | 5.8 along slit | degrees |
| Pixel size | 1.4 x 1.4 | arcmin |
| Slit size | 2 x 256 | pixels |
| Wavelength | 0.7 - 1.8 | μm |
| λ/Δλ | 13 ~ 15 | |
| Optics efficiency | 0.8 | |
| Array | 256x256 | HgCdTe |
| Array QE | 0.6 | |
| Operating temperature | 77 | K |
| Photo current | 10 ~ 20 | e-/s/td> |
| Dark current | < 0.1 | e-/s |
| Read noise (CDS) | < 30 | e- |
| Photon noise (15s) | 12 ~ 17 | e- |
| Limiting mag (15s) | 16 | J band 3σ |
[Back to Overview]